How happy do you think you are?
Understanding Happiness
Do you consider yourself to be happy? If you are not, do you know how you can improve it? If you are satisfied, what's contributing to your happiness, how can you maintain this level of happiness? These are some of the questions we asked ourselves when we saw the World Happiness Report [1].
In today's world, everyone is chasing happiness. We are constantly bombarded with ads for products and experiences that promise to deliver joy, but the true indicators and drivers of happiness are complex and deeply interconnected. Variables such as national economic stability and socioeconomic status are often researched in relation to happiness. However, factors such as these are far-removed from an individual's experience, and are difficult to effect change on. As the global "wellness" industry continues to create everything from new mindfulness apps to expensive health supplements claiming to have found the key to happiness, the answer to the age-old question "what makes people happy?" remains elusive.
Our project aims to explore the relationship between happiness and various tangible, and most importantly, changeable aspects of individuals' lives to see if there really is a key to global happiness. We examine factors such as nutrition, caffeine, alcohol consumption, living location, and other aspects within an individual's control. Our goal is to dig deeper than national factors, and examine to offer a data-driven perspective on how individuals, local policymakers, and societies can cultivate happiness in meaningful and sustainable ways.
The World Happiness Report
The World Happiness Report is the world's foremost publication on global wellbeing. It is created using data collected by Gallup, the University of Oxford's Wellbeing Research Centre, the UN Sustainable Development Solutions Network. It ranks countries based on self-reported life satisfaction, measured using the Cantril Self-Anchoring Striving Scale (Cantril Ladder), which asks respondents to rate their life on a scale of 0 to 10 [2].
The Cantril Ladder
Respondents are asked to think of a ladder, with the best possible life for them being a 10, and the worst possible life being a 0. They are then asked to rate their own current life on that scale.
Global Happiness Trends (2019-2022)
Below you can see the happiness of every country over the last 4 years. To see a specific country, click on the name on the right, and examine their trend.

While the previous visualization gave us a clear overview of overall trends in the last 4 years, we wanted to break the dataset down into more recognizable groups that told us about the global distribution of happiness scores. As such, the following dives deeper into continental trends to better understand regional variations

Nutrition and Happiness
Our dietary choices significantly impact our mental health and happiness. Consuming a balanced diet rich in fruits, vegetables, and essential nutrients can enhance mood and overall well-being. Recent discoveries in the mind-gut connection demonstrate that the gut and brain are intimately linked through a network of nerves, chemicals, and gut microbes that influence how we feel. This gut communication network has even been dubbed "the second brain." Connected via the vagus nerve, disruptions in this connection can affect mood, anxiety, and even cognitive functions. In fact, around 90% of serotonin—often called the happiness chemical—is produced in the gut. Supporting gut health through a diverse, nutritious diet may therefore directly improve mental wellness and emotional stability [3].
Meat Consumption and Happiness
One of the most common differentiators between diets is the level of meat consumption, and the types of meat(s) that are most common. Let's see if consumption of meat has any correlation with global happiness rates.

To see the trends for a specific meat category select the meat categories you'd like to see on the side panel. The trend line represents the overall trend between consumption of each meat type and happines
Insight: Examining the trend lines for each meat category there appears to be a positive correlation between meat consumption per capita and happiness scores. While correlation doesn't imply causation, countries with greater access to meat also report higher happiness. Specifically, Beef, Pork, have notably the strongest correlations with higher levels of happiness. Chicken also has a slightly positive correlation, but it is not as strong indicating that it may have a weaker relationship. The trend line we see with chicken may also have to do with the fact that chicken is eaten the most across the globe, meaning that it may be more accessible across all happiness levels. Lastly, goat & lamb consumption has the widest spread of happiness scores, with no strong visible pattern. This may reflect regional preferences in countries where goat/lamb is a staple.
Vegetable Consumption and Happiness
The other side of meat consumption is high vegetable consumption, let's take a look at vegetable consumption across the globe, and see if it has any relation to global happiness.
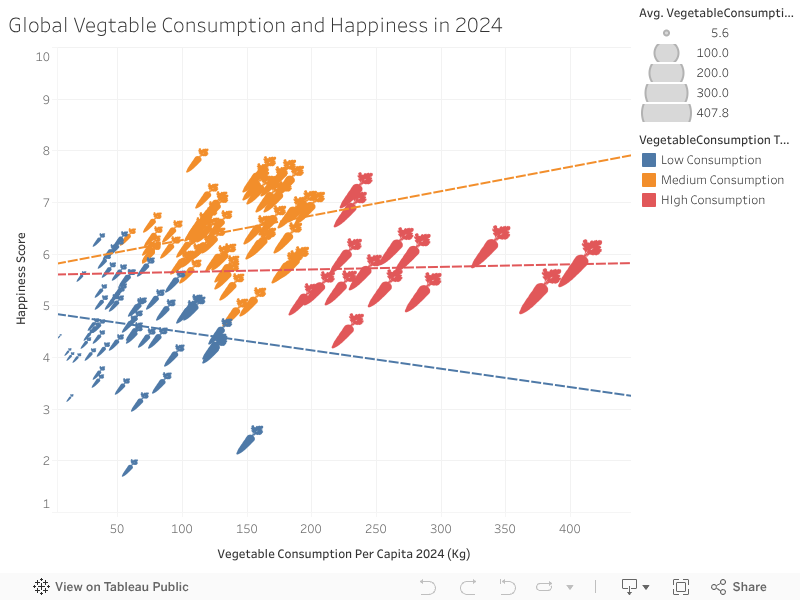
To see the trends for a specific consumption level select the level you'd like to see on the side panel. The trend line represents the overall trend between consumption at each consumption level and happiness
Insight: The figure shows that medium consumption of vegetables has the strongest positive correlation with happiness. Surprisingly, the high consumption group flattens out, suggesting a plateau effect—more vegetables after a certain point doesn't lead to greater happiness. However, the low consumption group actually trends downward, which might imply that insufficient vegetable intake is linked with lower well-being and lower overall happiness. Most notably, however, Medium vegetable consumers cluster more tightly and consistently high, implying this range may represent nutritional balance or optimal intake.
Caffeine Consumption and Happiness
While the role of daily nutrition in supporting overall well-being is well established, what about the substances we consume beyond food? Substances like alcohol are often linked to negative health outcomes when overused, while caffeine—one of the most commonly consumed stimulants worldwide—is associated with increased energy, focus, and even improved mood. By examining global patterns of alcohol and caffeine consumption, we can begin to uncover how these everyday habits may influence happiness and life satisfaction across different cultures and regions.
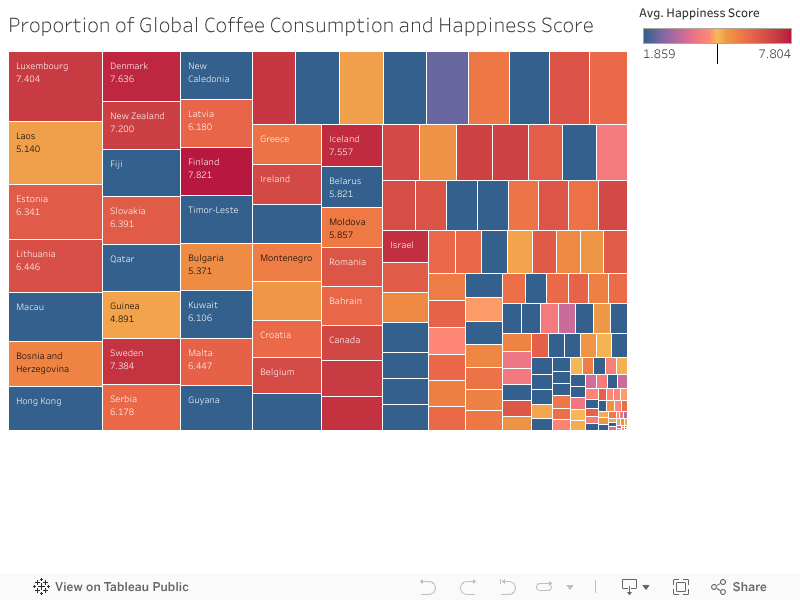
In this visualization, the size of the box correlates to the proportion of global caffeine per capita in 2024 while the color of the box correlates to happiness levels for that country (the happiness score is also represented by the number in each box). If you are interested in any of the boxes where there is no text, hover of it to see country, caffeine consumption, and happiness scores.
Insight: In this visualization we can see that the countries with the highest happiness scores also have higher caffeine consumption per capita. However, this is not to say that there is a strong correlation between happiness and caffeine intake. We actually see a mix between high caffeine consumption and high happiness scores - and vice versa. Many of the countries with the highest happiness consumption are Nordic and Western countries that also have high caffeine consumption rates. While there is some correlation between caffeine consumption and happiness, High coffee consumption may reflect affluent, urban lifestyles, strong café culture, or social rituals, all of which are associated with community bonding and daily structure, contributing to well-being.
Alcohol Consumption and Happiness
How about alcohol? While it can lead to liver damage and heart damage, can it improve happiness outcomes in moderation?
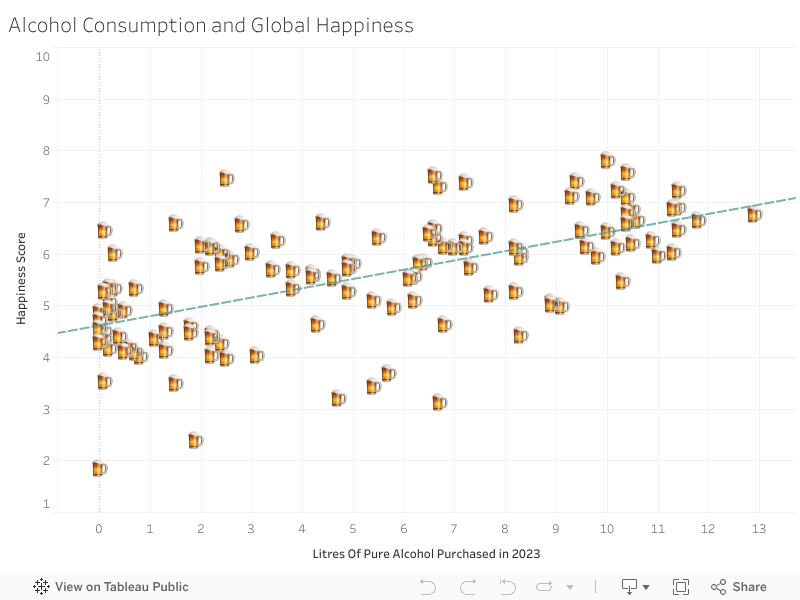
This visualization shows the relationship between alcohol consumption and happiness scores across different countries.
Insight: While there is a slight correlation in alcohol consumption and happiness scores, the correlation does not imply causation. It's more likely that alcohol consumption correlates with other quality-of-life factors (ie. leisure time or social freedoms) that contribute to happiness, rather than being a direct driver of it. Specifically, in more developed nations, where social drinking is common and regulated, alcohol may play a role in social connection and leisure.
Social Connectedness and Happiness
Since the correlation between alcohol and happiness is best explained by the correlation of alcohol in social settings, we asked the question: How important is social connectedness to happiness outcomes?
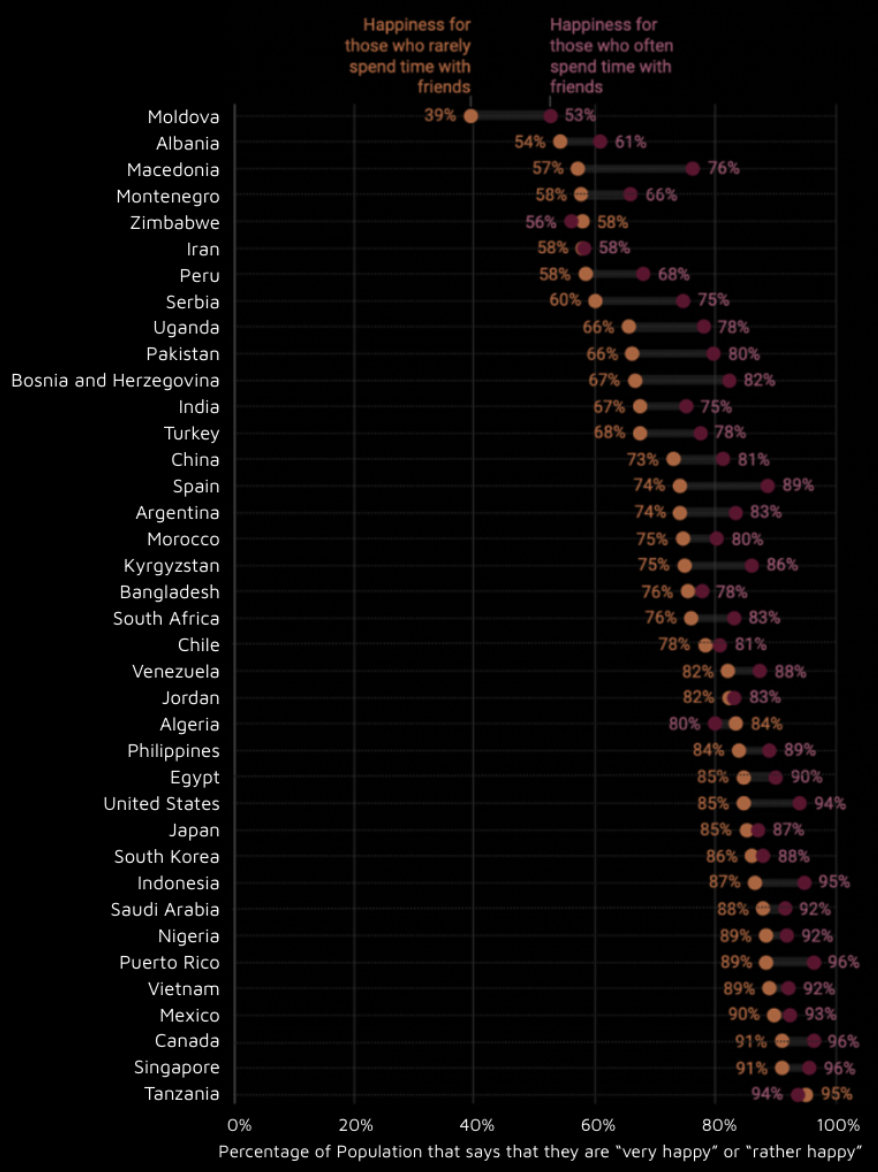
Insight: This graphic is one of the most illuminating we've looked at so far. In every single country, people who often spend time with friends report much higher levels of happiness. Countries like Moldova and Albania show dramatic contrasts: only 39% and 54% of those who rarely socialize report being happy, compared to 61% and 76% among those who often do. This illustrates how social interaction can shift the overall happiness landscape within populations. Countries like Canada, Mexico, and Singapore, where the general population already reports high happiness (90%+), still sees additional benefits for those who socialize more often. This suggests social interaction reinforces happiness even in well-being-optimized societies. Overall, this reflects a universal pattern across cultures and economies, underlining the essential role of friendships and human connection in well-being.
Living Location and Happiness
Social connectedness is not determined in isolation. The region of a country you live in (whether that is urban, rural, or suburban) can be closely correlated and play a big role in determining your social connectedness. Specifically, the availability of restaurants, shops, and living in a walkable environment may also have an effect on people's happiness. As such, we wanted to dig into this area of well-being and examine the real weight it has. Here, we present a map that shows the proportion of the country that lives in a rural area vs the happiness score of that country (hover over a specific country if you want to view its proportion) [4].

Insight: Overall, it seems that red countries (lower proportion of urban population) have lower happiness scores and vice versa for blue countries.
Transportation and Happiness in America
Living location also has a big impact on individuals' ability to use certain modes of transportation. We chose to examine transportation as a factor influencing happiness because commuting, specifically to work, is a daily routine for millions of people and as such could have a significant impact on overall well-being. This is also one of the things in your daily life you have power over, so we asked the question: does the way you go to work impact your "happiness"?
The time spent traveling to work, the mode of transportation used, and the associated stress can shape individuals' mental and emotional states [5]. With the rise of remote work and shifts in transportation patterns during the COVID-19 pandemic, we wanted to explore whether changes in commuting habits might correlate with variations in happiness. By analyzing these trends, we hope to better understand how something as routine as commuting could influence broader aspects of life satisfaction.
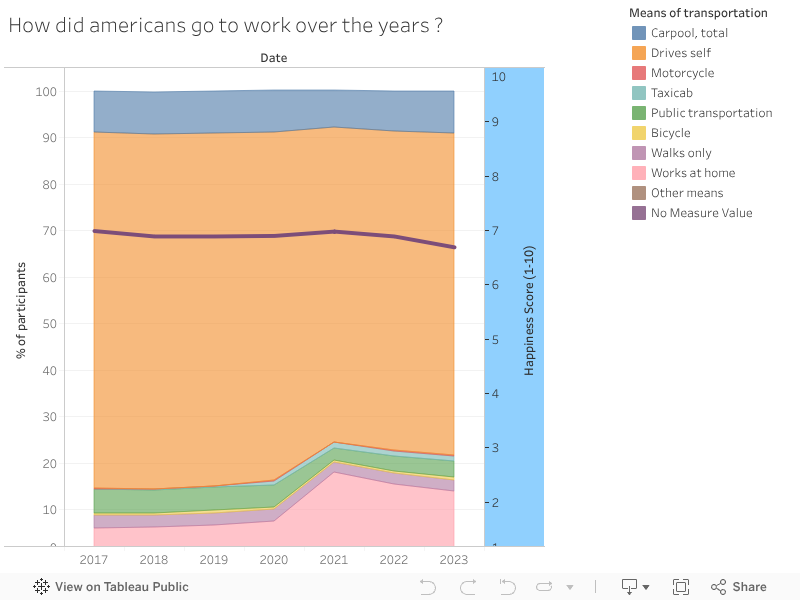
This graph shows for each means of transportation the percentage of the American population that took it to work. The line represents the evolution of the happiness score of the US through the years. To highlight a particular means of transportation click on its name on the right side of the graph.
Insight: The visualization highlights transportation trends in the U.S. and their potential relationship with happiness levels. A significant portion of the population drives alone to work, but a notable peak in alternative transportation methods and people staying at home occurred in 2020, likely due to the COVID-19 pandemic. As the use of these alternative modes decreased post-2020, there was a slight but similar decline in happiness scores in the U.S. The correlation between these two factors is minimal and the decrease in happiness could be related to many other factors than only commuting to work. In this case, because the relationship appears weak, further research would be needed to draw any strong conclusions.
Job Satisfaction and Happiness
Now that you've arrived at work, how satisfied are you with your career? The global average workweek is around 35 hours per week [6], but that figure doesn't capture the full scope of how much space work occupies in people's lives. Beyond the hours spent physically at a job, many people dedicate significant time commuting, responding to work-related messages outside of office hours, and mentally processing tasks or workplace dynamics. In many ways, work shapes our routines, our social lives, and even our sense of identity. Given this deep entanglement, we were curious to see whether job satisfaction—how people feel about their primary source of labor and income—has a measurable relationship with overall life satisfaction. Specifically, we wanted to track whether a higher proportion of people reporting job satisfaction correlates with a higher national happiness score.

This graph shows how the population feels about their job (segmented into three color coded categories - Dissatisfied, Netural, and Satisfied. The names of the countries are listed beneath the graph.
Insight: There is a clear positive relation with the proportion of the population that is satisfied with their job and the country's happiness score. Of course, job satisfaction was a self-reported value, and this may also have to do with the amount of income one makes and other factors that one cannot change, so this is just a correlation, not a causation.
Internet Usage and Happiness
Along with the time we spend at work, daily "scrolling-time" has become ubiquitous. We chose to examine internet usage as a factor influencing happiness because of the impact it has on daily life for billions of people. It facilitates communication, provides access to entertainment, education, and work opportunities, and helps maintain social connections—all of which can positively affect an individual's overall well-being. Research suggests that the internet can promote happiness by strengthening social ties and reducing feelings of isolation. As internet access has expanded globally, we wanted to investigate whether there is a correlation between increasing internet usage and rising happiness levels across different countries.
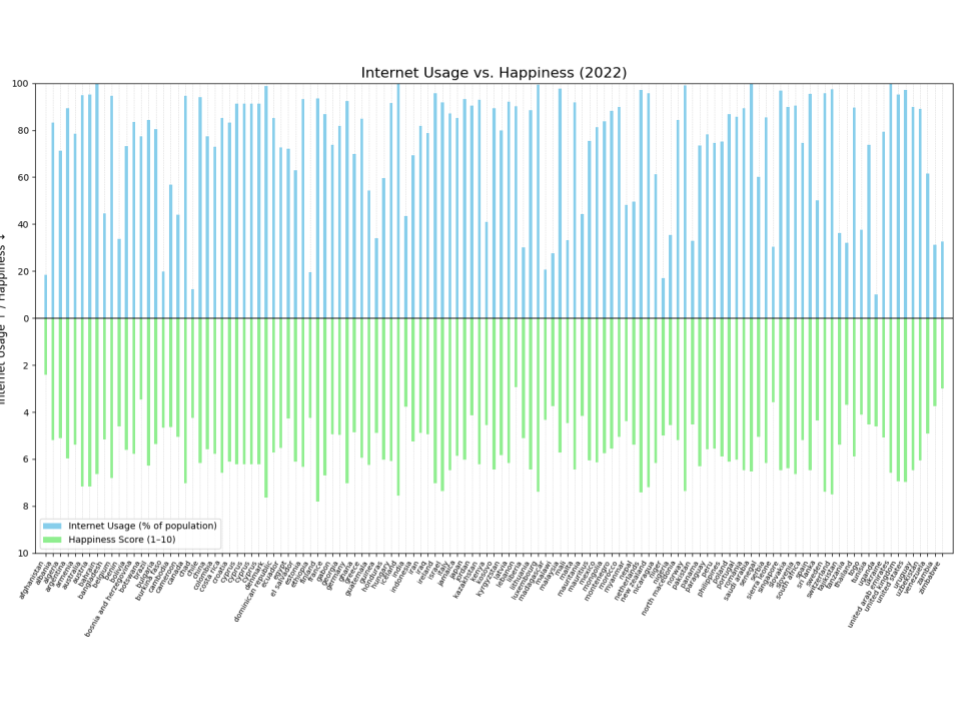
This graph shows in blue the percentage of population that uses internet for each country and in green the happiness score (1-10) of the corresponding country. The name of the countries are listed beneath the graph.

This graph shows for each country the percentage of population that uses the internet regarding the happiness score (1-10) of the corresponding country. The size of the circles also corresponds to the internet usage in order to see more clearly a possible correlation. In order to see the specific information of one dot (country, happiness score and internet usage) hover over the interesting dot and a box with details will appear.
Insight: The first plot we created shows bars
representing happiness and internet usage rates, allowing us to see if
they fluctuate similarly between countries. By comparing these two
factors side by side, we can observe if increases in internet usage
align with changes in happiness scores.
From this first plot, we can see that there may be a correlation
between internet usage and happiness, as the trends in both seem to
fluctuate in a similar manner across countries (the mirror effect is
almost working). While this initial observation suggests a potential
link, we wanted to create a second plot to better visualize and
quantify this relationship, in hopes of identifying a clearer pattern
and strengthening the evidence for any correlation.
Generosity and Happiness
We always hear that doing good deeds makes you happier, but does generosity really play a role in happiness?
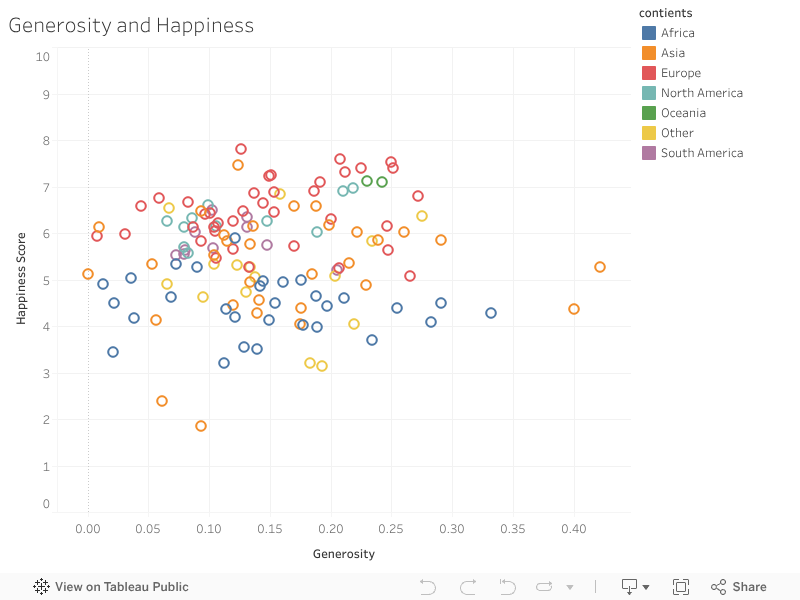
This graph demonstrates the self-reported generosity scores.
Insight: While there are no strong trends, there is a slight upwards trend which could suggest that being kind to your neighbors is good for you too! It is important to reiterate that these scores are self-reported meaning that cultural norms and personality differences could cause a person to over/under report their altruistic efforts. That being said, the slight possible trend could still indicate that whether generosity is real or perceived, feeling kind or helpful could positively influence life satisfaction.
Pet Ownership and Happiness
We chose to examine pet ownership as a factor influencing happiness because pets can play a significant role in people's emotional lives. Whether it's the companionship of a dog or the calm presence of a cat, animals often provide emotional support, reduce stress, and add joy to daily routines. Unlike many external factors, choosing to adopt a pet is a decision within our control—making it a potentially meaningful way to boost well-being.
Several studies have explored the psychological benefits of pet ownership, including reduced feelings of loneliness, increased physical activity (especially with dogs), and a stronger sense of routine and purpose [7]. During the COVID-19 pandemic, pet adoption rates soared, hinting at the comfort pets brought during a time of isolation and uncertainty. We wanted to explore whether this emotional connection translates into measurable differences in happiness.
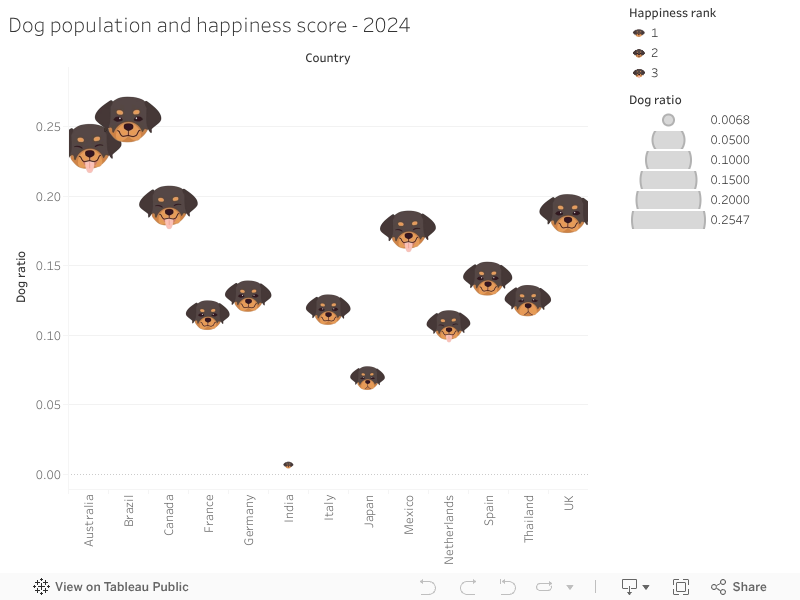
This graph plots the dog/person ratio for several countries. The size of the dog's head represents the dog/person ratio and the amount of smile showing on his face represents the happiness score of this country. For example a large head with a big smile means that there are a considerable amount of dogs per person in this country and that their happiness score is pretty high.
In order to see the specific information of one dot (country, happiness score and dog ratio) hover over the interesting dot and a box with details will appear.
The graph shows a little tendency for countries that have a larger dog/person ratio to have a higher happiness score: the bigger the head, the more likely the country will have a high happiness score.
What about cats?
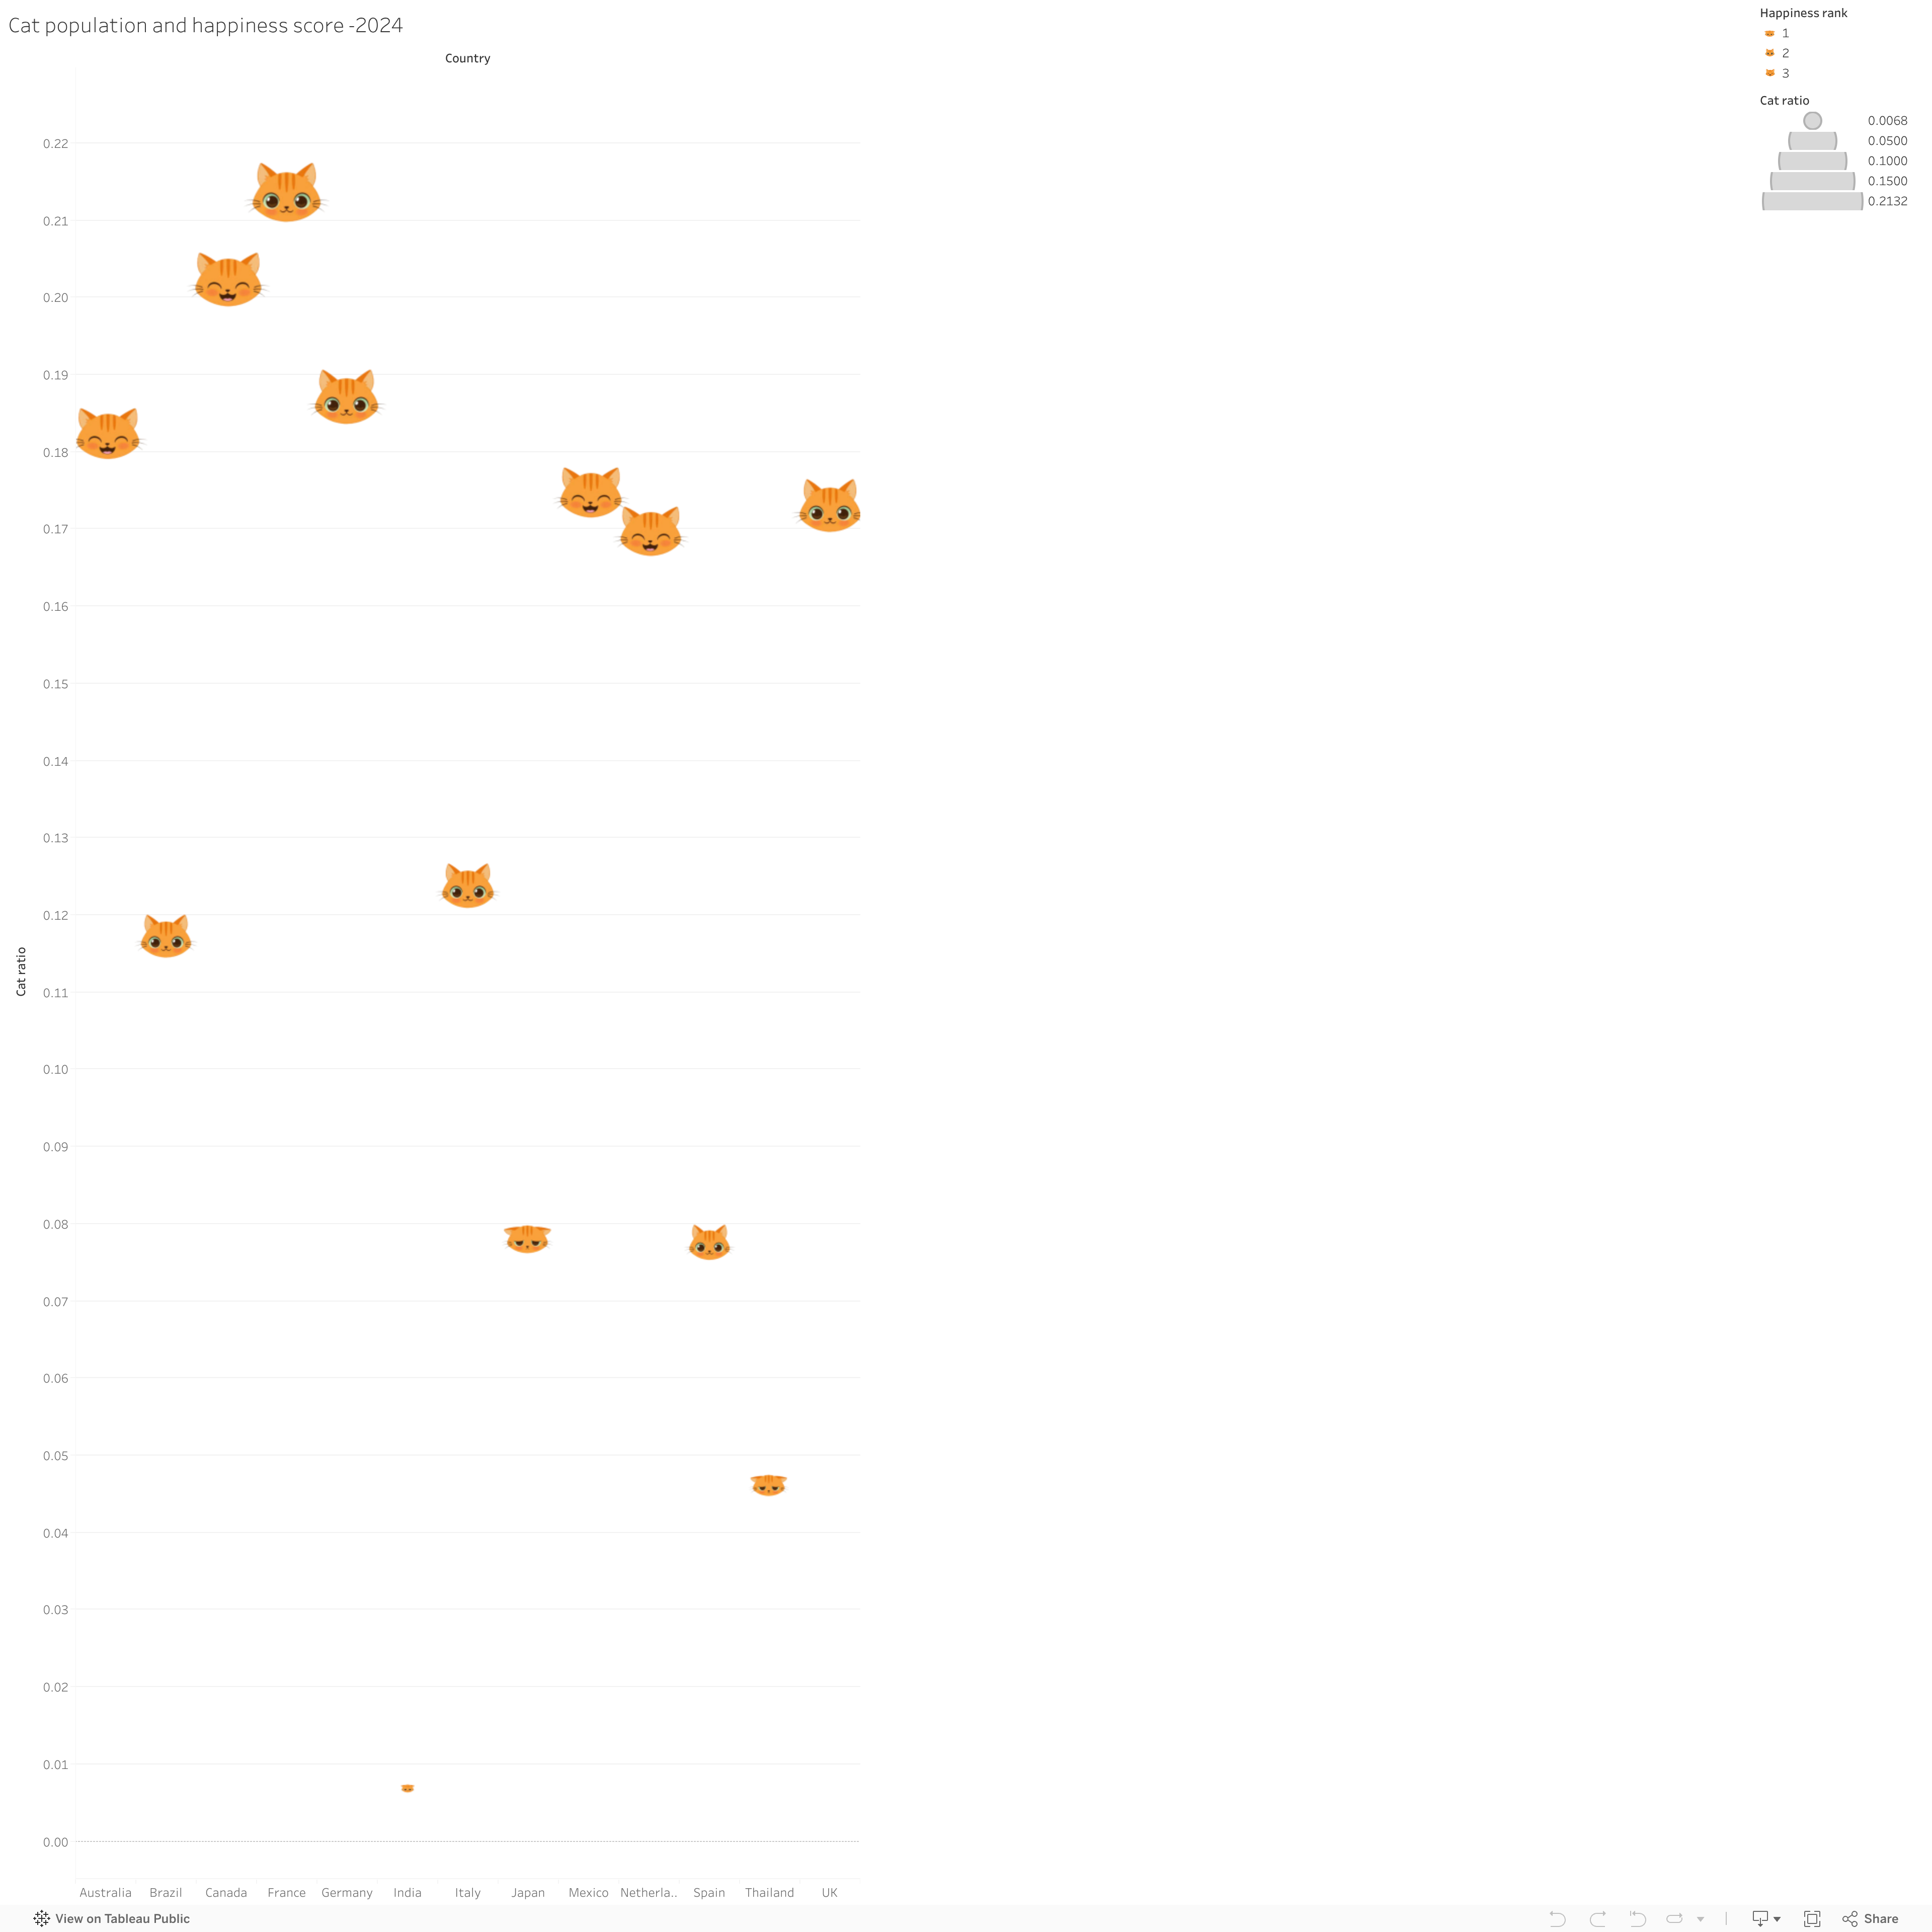
This graph plots the cat/person ratio for several countries. The size of the cat's head represents the cat/person ratio and the amount of smile showing on his face represents the happiness score of this country. For example a large head with a big smile means that there are a considerable amount of cats per person in this country and that their happiness score is pretty high.
In order to see the specific information of one dot (country, happiness score and cat ratio) hover over the interesting dot and a box with details will appear.
The graph shows a little tendency for countries that have a larger cat/person ratio to have a higher happiness score: the bigger the head, the more likely the country will have a high happiness score.
However, it needs to be noted that the relationship between pets and happiness is likely more nuanced and personal—perhaps showing up more clearly in individual case studies than in population-wide data.
Insight: Our analysis shows a slight tendency for countries with a larger dog/person ratio to have higher happiness scores, and similarly for cat ownership. However, it needs to be noted that the relationship between pets and happiness is likely more nuanced and personal—perhaps showing up more clearly in individual case studies than in population-wide data. In conclusion, while owning a pet may contribute positively to personal happiness, the broader trends suggest that many other variables also influence national happiness levels. More targeted research could help us understand exactly how and when pets make the biggest difference.
Conclusions
Our exploration into the many facets of happiness reveals a compelling truth: while we often think of happiness as elusive or rooted in external circumstances beyond our control, many of its key drivers lie in the small, everyday choices we make. That being said, we also found that happiness isn't about one single thing: it's shaped by a mix of daily habits, social ties and lifestyle choices. Big-picture factors like national policies and the economy hold weight, but the everyday decisions people make still play a big role in determining a person's happiness.
Across nutrition, transportation, social interaction, internet use, and even pet ownership, we see clear trends that suggest happiness can be shaped and directed—if not entirely predicted—through lifestyle and environment. Some fun and surprising patterns that we saw were that: people who eat a moderate amount of veggies, have good internet access, or own pets tend to report being happier. But it's not always straightforward. For instance, more meat or caffeine might be linked to happiness, but that could be because of things like income or culture, not the food or drink itself. A lot of these factors are connected in complicated ways, so it's hard to say what's really causing what.
However, social connection emerged as one of the most consistent predictors of happiness across all geographies—those who regularly spend time with friends are significantly more likely to report high life satisfaction. This insight cuts through cultural and economic boundaries and reminds us of the universal human need for belonging.
Meanwhile, transportation patterns, job satisfaction, internet connectivity, and urban living reflect the structural and societal dimensions of happiness. While some of these are harder to change at an individual level, they illuminate opportunities for policymakers and urban designers to better support citizens and their well-being.
Despite all of these if's and or's, and extenuating considerations is that little lifestyle changes might make a difference. Everyone's version of happiness looks a bit different, but staying connected, building healthy routines, and creating a good environment—both at home and in our communities—can help us get a little closer to it. So, be open to change, and keep your friends close for the exhilarating ride of life.